Platform Logs
Platform Logs is the organization-wide event stream for QuickFlo. It brings workflow messages and trigger activity into one searchable timeline.
Use it when an investigation is wider than one execution: a schedule that did not fire, a pattern of provider errors, a workflow emitting the same warning across many runs, or a live rollout you want to watch.
Where logs come from
Section titled “Where logs come from”QuickFlo automatically writes a log whenever a step errors in any workflow execution. You do not need to add a logging step to see those failures here.
Workflows can also produce their own events with the Log (core.log) step. Its channel defaults to the workflow that called it, which makes related messages easy to group. Set a different channel in the Log step when you want several workflows to share a stream, or when one workflow emits distinct kinds of events.
Search the stream
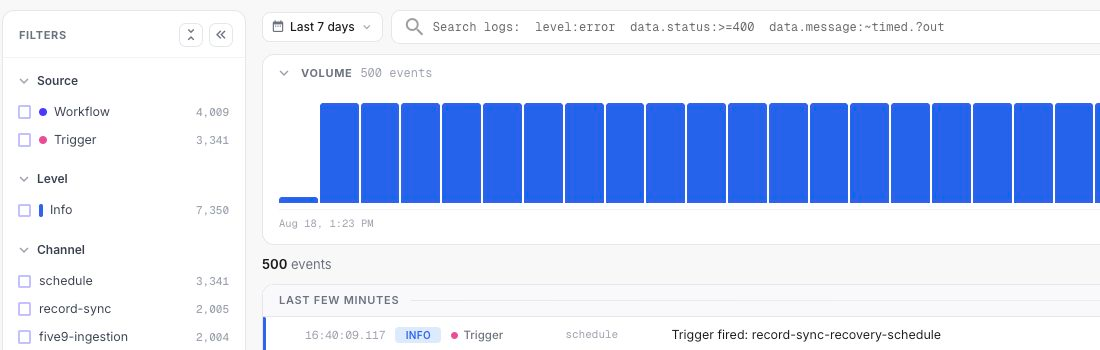
Section titled “Search the stream”Choose a time range, then search with plain text or a field filter:
level:errordata.status:>=400data.message:~timed.?outPlain text is best when you remember a phrase. Field filters are better when you know the shape of the event. You can combine the two and use the filter rail at the same time.
The available facets come from the events in the selected window. Common groups include:
- Source — workflow or trigger.
- Level — debug, info, warning, or error.
- Channel — the workflow-derived or explicitly named stream, such as
schedule. - Provider — the external service when one is recorded.
- Origin — the step or system surface that emitted the event.
- Tags — labels added by the workflow or platform.
Facet counts show how much of the current result set each value represents.
Use the volume chart
Section titled “Use the volume chart”The chart above the stream shows event volume over the selected window, broken down by level. Select a bar to jump to that period.
Spikes are often the quickest clue: a burst of errors after a deployment, a silent gap in scheduled activity, or an unusual increase in one channel.
Read an event
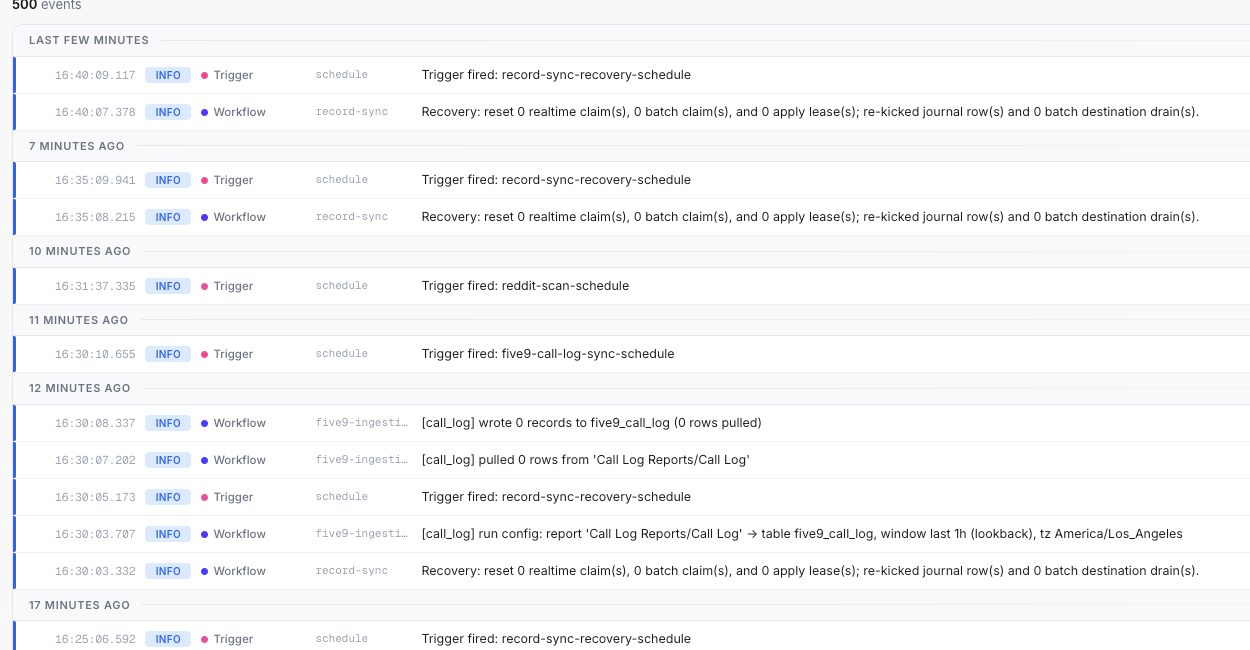
Section titled “Read an event”Each row keeps the common fields visible: timestamp, level, source, channel, and message. Open the row for its structured data and related identifiers.
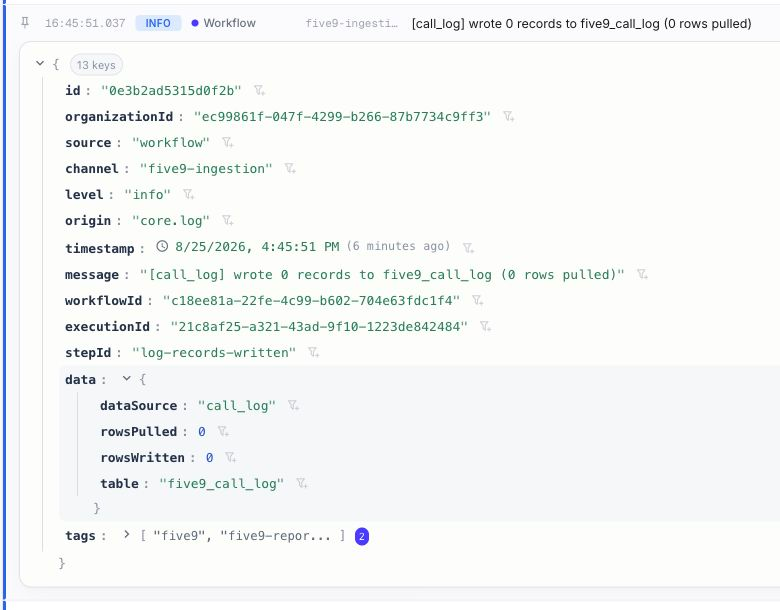
Expand a row to see the complete event. Workflow logs include the workflow, execution, and step IDs alongside any structured data and tags the step recorded.
Use the row actions to copy or pivot on a useful value. Pin an event when you want to keep it visible while comparing nearby entries.
QuickFlo shows times in your selected timezone. The timezone appears above the stream so exported timestamps and conversations with teammates stay unambiguous.
Follow activity live
Section titled “Follow activity live”Turn on Live tail to follow new events as they arrive. This is useful while testing a trigger, rolling out a workflow, or reproducing an intermittent problem.
Pause live tail before reading older entries or refining a complex search. Otherwise new activity can move the stream while you investigate.
A reliable investigation path
Section titled “A reliable investigation path”- Set the smallest time range that still includes the incident.
- Filter by source and level.
- Use the volume chart to find the relevant burst or gap.
- Open one representative event and note its workflow or execution ID.
- Move to Executions when you need the full step-by-step trace.
Logs tell you what the system reported across time. Executions tell you what happened inside one run. Most investigations use both.