Executions
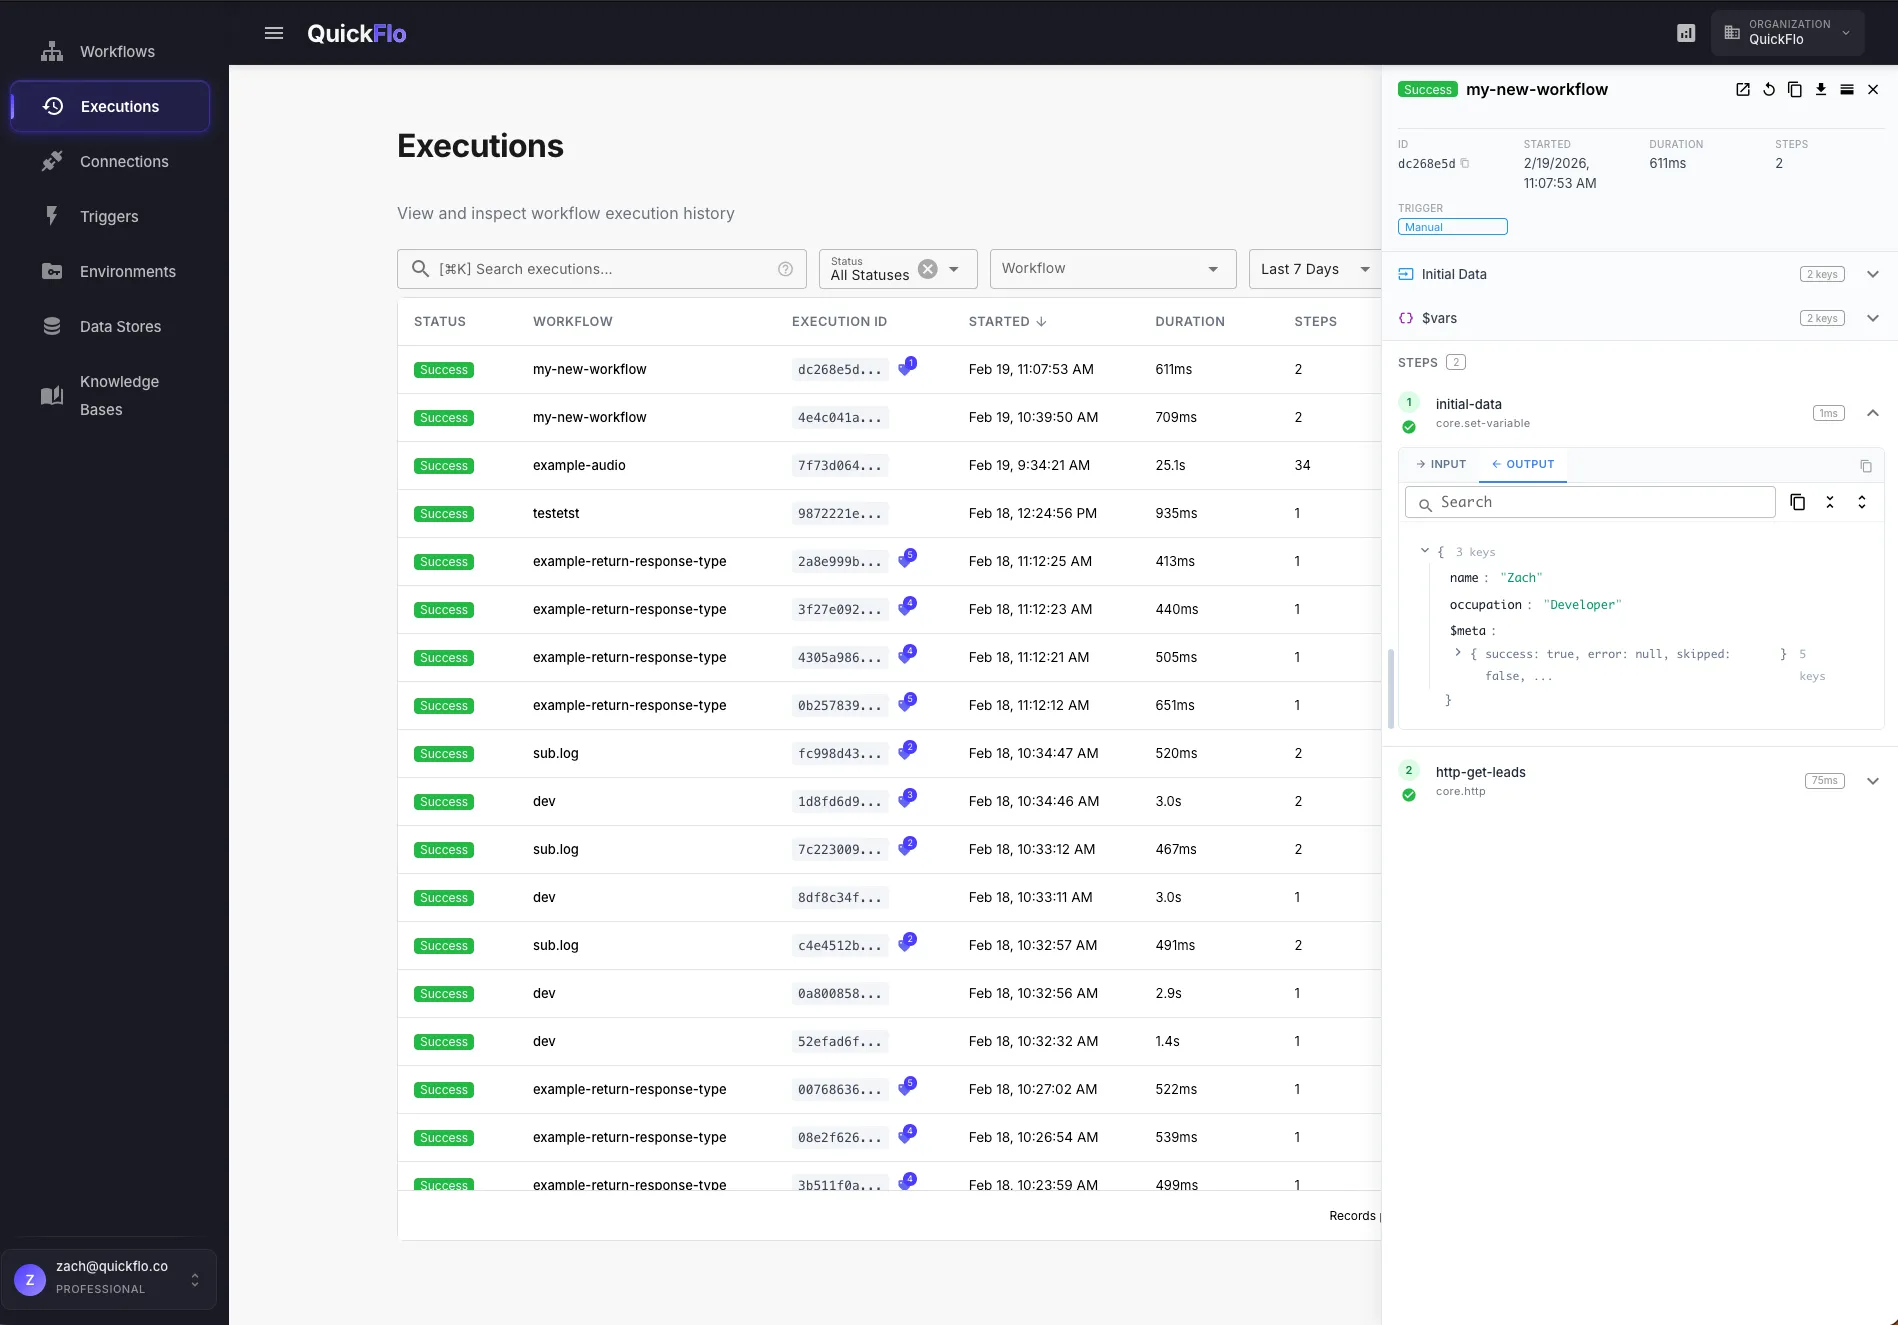
The Executions page gives you a centralized view of every workflow execution in your organization. Monitor runs across all workflows, search through input and output data, filter by status or time range, and drill into individual executions to inspect step results.
The Executions Table
Section titled “The Executions Table”Each row in the table represents a single workflow execution with the following columns:
| Column | Description |
|---|---|
| Status | Running, Success, Completed with Errors, Failed, or Cancelled — see Status Reference below |
| Workflow | The name of the workflow that ran |
| Started | Timestamp when the execution began |
| Duration | Total execution time |
| Steps | Number of steps that ran |
| Trigger | How the execution was started — Manual, Webhook, Schedule, Form, or Event |
The full execution ID and any error messages are visible in the detail panel that opens when you click a row — hover over the Status badge for a quick error preview without opening the row.
Status Reference
Section titled “Status Reference”| Status | Meaning |
|---|---|
| Running | Execution is in flight |
| Success | All steps completed without execution errors and without error-level operational errors |
| Completed with Errors | The workflow finished, but at least one step reported an operational error along the way. This happens when a warning-level operational error didn’t halt the workflow, or when a step with Continue on Error absorbed an error-level operational error. |
| Failed | A step threw, hit an unrecoverable operational error (severity error), or was halted by the engine. See the failing step’s $meta.error and the global $errors array for details. |
| Cancelled | The execution was cancelled (manually or by an upstream cancellation) |
Filtering Executions
Section titled “Filtering Executions”Use the toolbar filters to narrow down the list:
- Search — full-text search across initial data and return values (
Cmd+Kto focus) - Status — filter by execution status (Running, Success, Completed with Errors, Failed, Cancelled)
- Workflow — filter to a specific workflow
- Date range — filter by time window (Last 7 Days, Last 30 Days, or custom)
Click Search to apply your filters.
Inspecting an Execution
Section titled “Inspecting an Execution”Click any row to open the detail panel on the right side. The panel shows:
- Header — workflow name, status badge, execution ID (with click-to-copy), start time, duration, step count, peak memory usage, and worker tier badge if not the default
- Initial Data — the input data the workflow received (from a trigger payload, manual input, or sub-workflow call)
- $vars — variables set during execution via Set Variable steps
- $errors — accumulated operational and execution errors (only shown when present)
- Steps — each step with its status, duration, retry count, and expandable output
From the detail panel you can:
- Open in builder — jump to the workflow editor with the execution loaded
- Re-run — re-execute the workflow with the same initial data
- Download — export the full execution data as JSON
Operational Errors
Section titled “Operational Errors”QuickFlo separates step failures into two channels — execution errors (the step threw) and operational errors (the step ran but the outcome was a problem like an HTTP 4xx). Both halt the workflow by default; only warning-severity operational errors continue automatically. Steps that absorb failures via Continue on Error appear here in Completed with Errors state instead of Failed.
For the full design — the two channels, severity, $errors, continueOnError, skipCondition, retry policies, and patterns for the most common scenarios — see the dedicated Error Handling guide.
The $errors panel inside each execution’s detail drawer lists every error from the run with structured detail (step ID, type, code, message, severity), and each individual step’s expanded view shows its $meta.error inline.
Worker Tiers
Section titled “Worker Tiers”Workflows can be assigned to a worker tier that controls the memory and CPU budget for each run. Set the tier under Workflow Settings → Execution Options:
| Tier | Use Case |
|---|---|
| Standard | Default — fits most workflows. Lower memory budget, fastest queue. |
| Heavy | Larger datasets, AI agents with long token budgets, or workflows that buffer file content in memory. |
| XL | The largest tier — for one-shot batch jobs, very large data transformations, or memory-intensive sub-workflow trees. |
The execution detail panel shows the worker tier as a badge whenever the run used something other than Standard, so you can spot which workflows are pinned to a heavier tier without opening the settings.
Row Actions
Section titled “Row Actions”Each execution row has quick actions on the right:
| Action | Description |
|---|---|
| Open | Open the execution in the workflow builder |
| Download | Export execution data as JSON |
| Re-run | Re-execute with the same initial data |
Data Security
Section titled “Data Security”Execution data is protected with two layers of security:
Encryption — All workflow result data (step outputs, input data, variable values) is encrypted at rest. Only execution metadata is stored unencrypted — things like execution ID, timestamps, status, duration, step counts, and trigger type.
Automatic redaction — Sensitive values are automatically redacted from execution details. Any field with a key matching common secret patterns — password, secret, token, apiKey, authorization, credential, privateKey, and others — is replaced with [REDACTED] before being displayed. This happens by default on all execution results so credentials never appear in the UI.
Searchable Attributes
Section titled “Searchable Attributes”Searchable attributes let you mark specific fields from a workflow’s initial data as indexed for filtering. Once configured, those values appear as badges on the Executions table and can be used to quickly filter executions by the data you care about — a customer ID, order number, environment name, or any other key field.
Configuring Searchable Attributes
Section titled “Configuring Searchable Attributes”Searchable attributes are set up in Workflow Settings under the Initial Input Schema section.
- Open the workflow builder and click the Settings icon
- In the Initial Input Schema section, add or find the field you want to index
- Click the search icon next to the field — it toggles between default (not indexed) and Searchable (indexed for filtering)
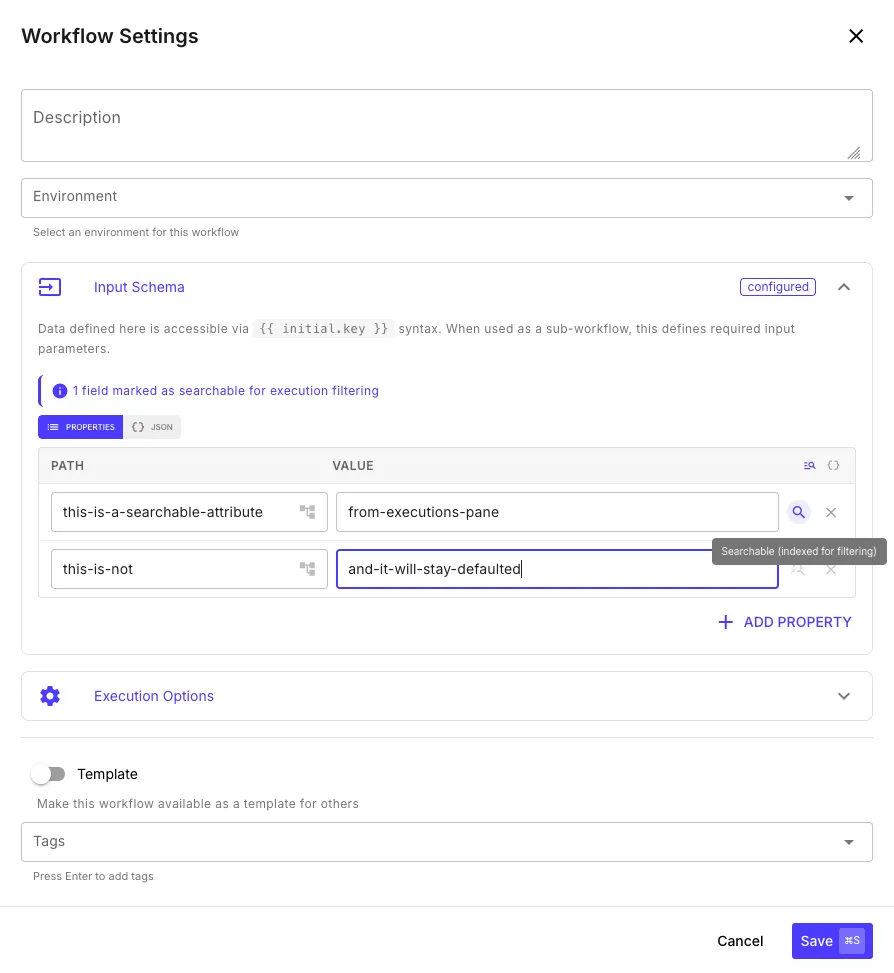
Fields marked as searchable show a highlighted search icon. A banner at the top of the Initial Input Schema section confirms how many fields are currently indexed.
Viewing Searchable Attributes
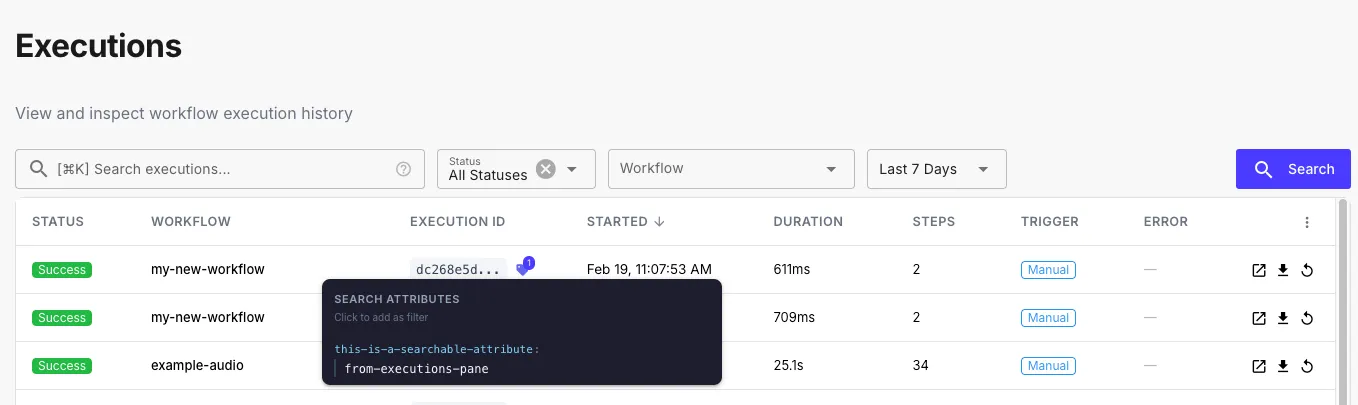
Section titled “Viewing Searchable Attributes”Executions from workflows with searchable attributes display a small badge next to the execution ID. Hover over it to see the indexed key-value pairs at a glance.
Filtering by Searchable Values
Section titled “Filtering by Searchable Values”There are two ways to filter by searchable attribute values:
From the Executions Table — hover over the searchable attribute badge on any execution row and click it. The value is added as a filter chip in the search bar, instantly narrowing the table to matching executions.
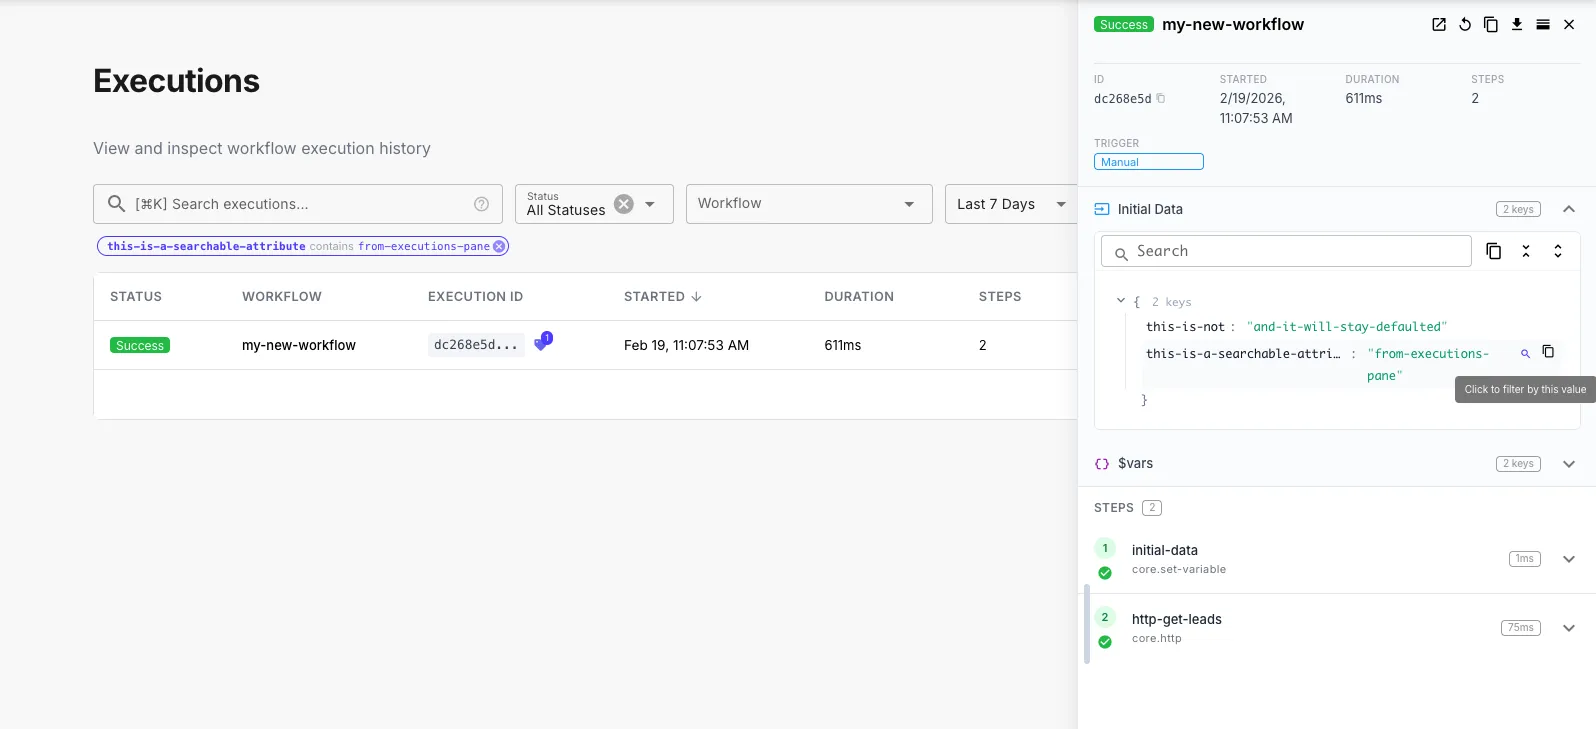
From the Detail Panel — click an execution to open the detail panel. In the Initial Data section, searchable fields show a search icon on hover. Click it to filter by that specific value.
Modifying Filters
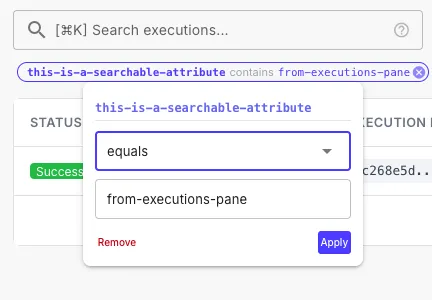
Section titled “Modifying Filters”Once a searchable attribute filter is active, it appears as a chip below the search bar. Click the chip to adjust:
- Operator — choose between
equals(exact match) orcontains(partial match) - Value — edit the filter value
- Remove — delete the filter
Example Use Cases
Section titled “Example Use Cases”| Searchable Field | Why |
|---|---|
customerId | Find all executions for a specific customer |
orderId | Trace a single order through your workflows |
environment | Filter between production and staging runs |
source | See which integration or webhook triggered runs |
batchId | Group executions from the same batch job |