
Dashboards
A dashboard turns records in a data store into a view people can use. Choose the measures that matter, add the dimensions that explain them, and give readers the filters they need.
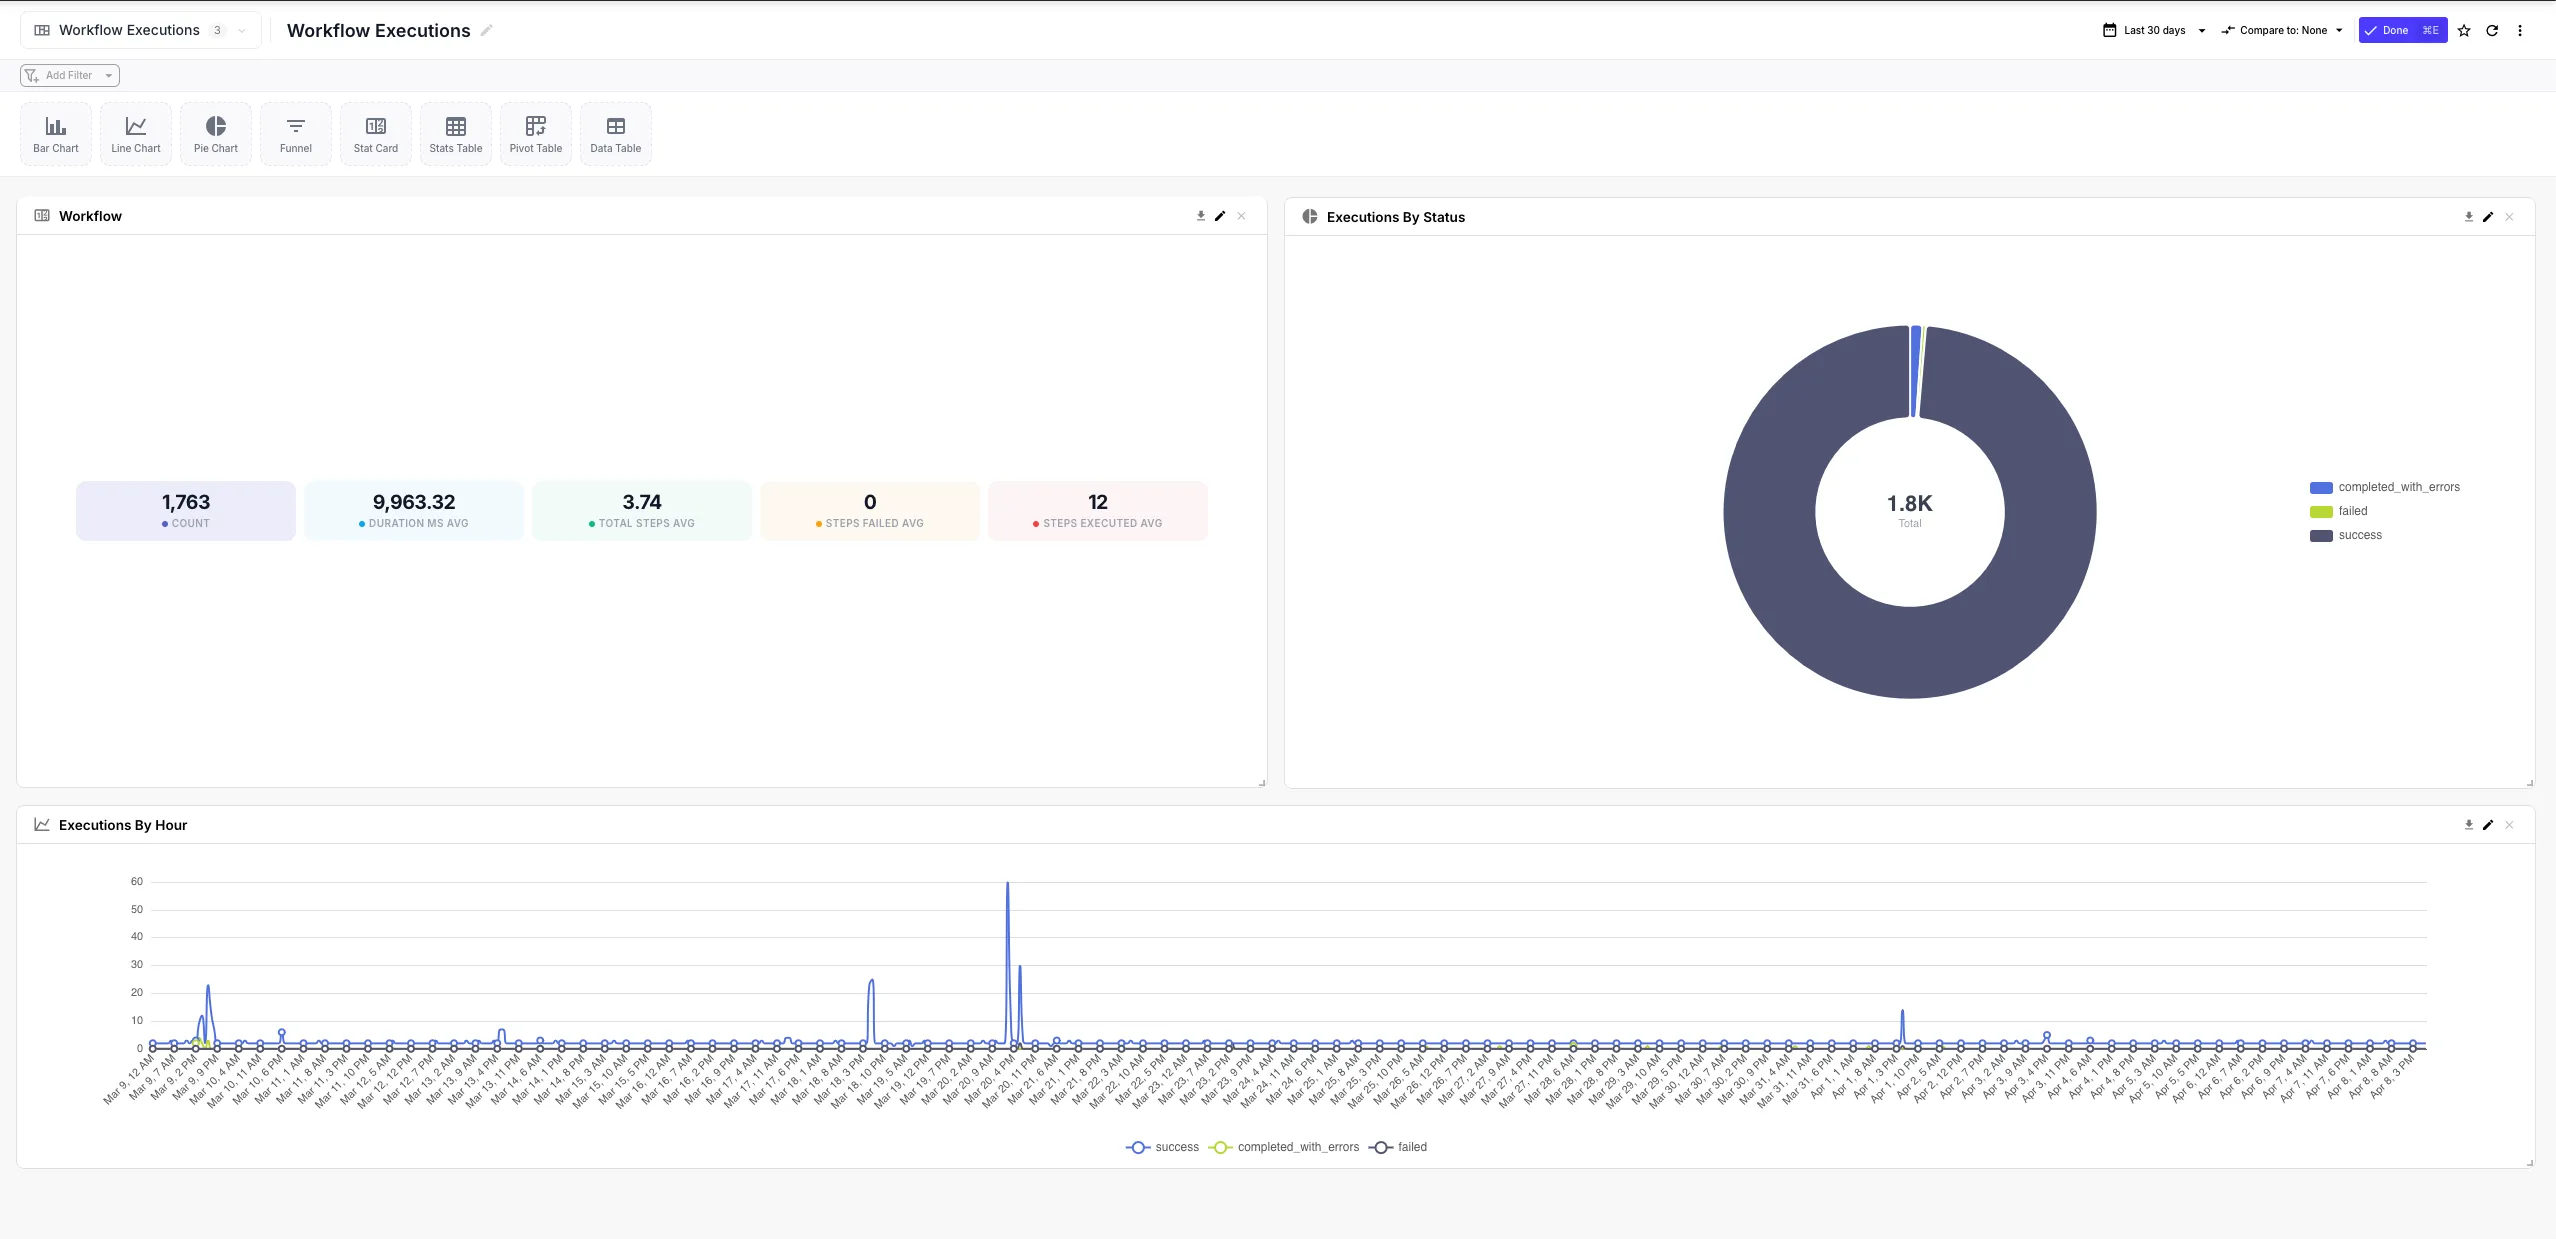
How dashboards fit together
Section titled “How dashboards fit together”| Concept | What it does |
|---|---|
| Data source | Selects the table and fields the dashboard can query |
| Widget | Renders a chart, table, metric, funnel, or pivot |
| Dashboard | Arranges widgets and coordinates their date range and filters |
QuickFlo detects field types when you create a data source. Those types determine which fields can be measured, grouped, filtered, or placed on a timeline.
Build the first view
Section titled “Build the first view”- Put the records you want to report on in a data store.
- Open Dashboards → Data Sources and select Add Data Source.
- Choose the table and, when needed, its time field.
- Create a dashboard and add a widget.
- Choose a measure, optional dimensions, and a time range.
- Add a dashboard filter when several widgets should move together.
The widget renders as soon as its query is valid. Drag it into place and resize it from the corner.
Choose the guide
Section titled “Choose the guide”| You need to | Read |
|---|---|
| Configure data sources, widgets, pivots, and shared filters | Build dashboards |
| Define a reusable measure, label, date value, or classification | Calculated fields |
| Move a dashboard between organizations or create a PDF | Export, import, and share |
| Understand the records behind a chart | Click the chart value to open its drill-down |
Keep the model simple
Section titled “Keep the model simple”A workflow writes operational records. A data source describes how to read them. Widgets turn them into a useful result. Keep each layer narrow and the dashboard remains easy to change.