
Export, import, and share dashboards
Dashboard definitions are portable. Export the layout and query configuration, then map it to the right data sources when you import it elsewhere.
Drill-Downs
Section titled “Drill-Downs”Click into any aggregated cell — a bar, a pie slice, a stat card, a pivot cell, a stats-table row — and a full-screen drill-down dialog opens showing the raw underlying records that contributed to that aggregate. Bar, line, pie, stat card, stats table, and pivot table widgets all support it; data tables don’t (they’re already showing rows) and funnels don’t either.
The dialog renders a data-table view containing every field from the underlying data source, with the click’s filters applied automatically — so the rows are scoped to whatever you clicked. The dashboard’s global filters and date range carry through too, so the drill-down always reflects the same slice you were looking at on the page.
Importing & Exporting Dashboards
Section titled “Importing & Exporting Dashboards”Dashboards are JSON. Export one, commit it to git, share it with a teammate, paste it into another QuickFlo organization — same dashboard, ready to go.
Export
Section titled “Export”From any dashboard’s menu, choose Export to download a .json file. The export contains:
- The dashboard’s layout, name, description, and filter config
- Every widget’s query config and display config with internal data source IDs replaced by stable export-only aliases (
ds-0,ds-1, …) - A schema fingerprint for each referenced data source so the importer can detect compatibility issues when remapping
Exports are intentionally not backed by the underlying rows — only the dashboard definition travels with the file. The data stays in the mapped data source.
Import
Section titled “Import”From the Dashboards page, click Import Dashboard and drop in a .json file. The import dialog walks you through two phases:
-
Upload — drag in the file. QuickFlo parses it and surfaces any structural errors before showing you the next phase.
-
Map data sources — for each data source the export references, pick one of your data sources to map it to. Each option shows a compatibility badge based on how well its detected schema matches the export’s schema fingerprint, so you can quickly spot which mapping is the safe one.
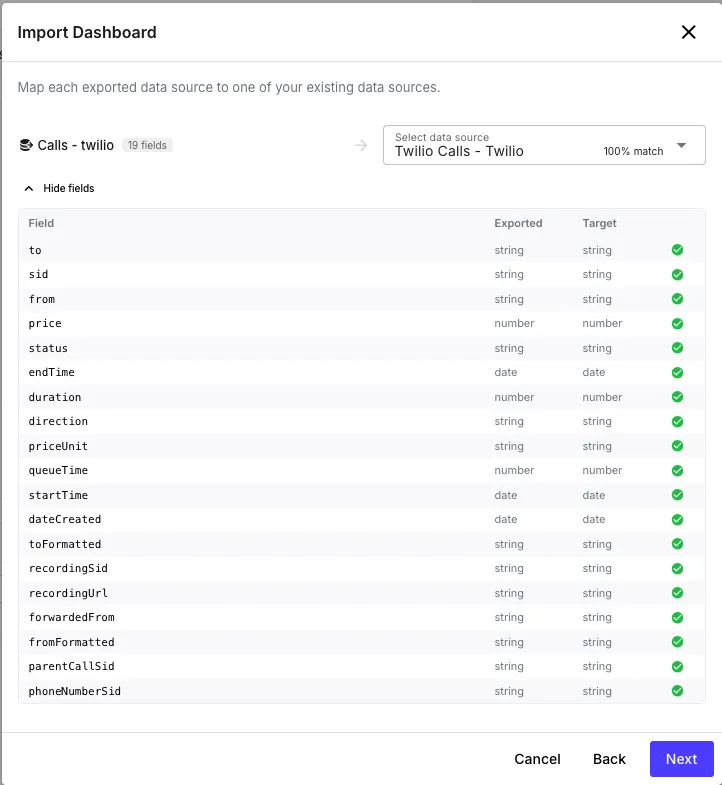
Click Import and QuickFlo creates a fresh dashboard in your org with all the widgets, filters, and layout intact — every data source reference, calculated field expression, and filter binding rewritten to point at the data sources you mapped.
This makes dashboards highly portable — you can build a starter dashboard once and reuse it across organizations, or version-control your important dashboards alongside the rest of your codebase.
PDF Export
Section titled “PDF Export”Beyond JSON export, you can also render any dashboard to a PDF for sharing with stakeholders who don’t have QuickFlo access. The PDF preserves widget rendering, layout, and the active filter state at the moment you exported, so the PDF is a frozen snapshot of what you were looking at on screen.
Sharing Dashboards Across Organizations
Section titled “Sharing Dashboards Across Organizations”Cross-organization sharing begins at the data store layer. Grant another organization read-only access to a table; it can then map that table into its own dashboards. See Share a data store for the setup walkthrough.
In the receiving organization, they add a data source, the shared table appears in the picker with a “Shared” badge, and dashboards built on it work exactly like dashboards on their own data — including filters, calculated fields, drill-downs, and exports.